SEARCHES

Overview​

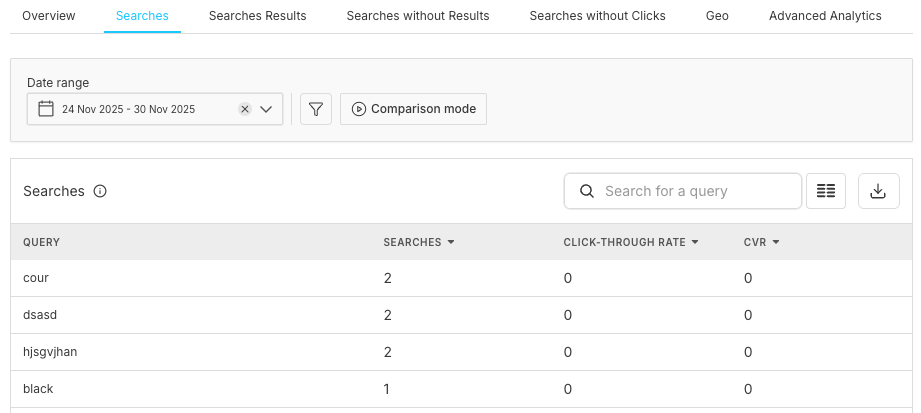
Searches provides detailed analytics for every search query performed on your platform. Analyze individual queries with metrics like search count, click-through rate, and conversion rate. Use this data to optimize search relevance and improve user experience.

For a broader view of your search analytics, see the Analytics Overview. To dive deeper into individual product performance, check Searches Results.


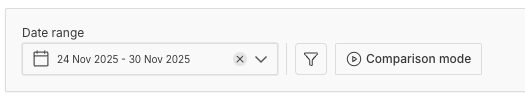
Comparison Mode​

Searches Analytics

For detailed information about Comparison Mode functionality, see Overview - Comparison Mode.


Filter Options​

Filter
Description
Available Options
Analytics Tags
Filter by search source or type
Placeholder: Select tags to filter metrics below
• back_to_school
• And other custom tags based on your configuration
Additional Tags
Secondary filtering for more precise analysis
Placeholder: Select tags to filter metrics below
• Custom tags and filters
• Campaign-specific tags
• User segment tags

View Options​

Icon
Functionality
Column Toggle ()
• Show/hide table columns
• Customize view
Download ()
• Export search data
• Download as CSV or other formats

Searches Table​

Table Columns​

Search Table
Column
Description
Details
Use Cases
QUERY
The actual search term entered by users
Sortable: Click header to sort alphabetically
Examples: Product names, categories, general terms
• Identify popular search terms
• Spot spelling variations
• Find trending queries
SEARCHES
Number of times this query was searched
Sortable: Click header to sort by volume
Format: Numeric count
• Prioritize high-volume queries
• Track query popularity
• Identify demand patterns
CLICK-THROUGH RATE
Percentage of searches where users clicked on results
Sortable: Click header to sort by rate
Format: Percentage (e.g., 28.57%, 16.67%)
Calculation: (Clicks ÷ Searches) × 100
• Measure result relevance
• Identify queries needing optimization
• Validate search improvements
CVR (Conversion Rate)
Percentage of searches that led to desired action
Sortable: Click header to sort by conversion
Format: Percentage or numeric (e.g., 0, 0.00%)
Calculation: (Conversions ÷ Searches) × 100
• Measure business impact
• Identify high-value queries
• Optimize for revenue

Column Interpretations:

Metric
Performance Interpretation
Click-through Rate
• High Click-through Rate (greater than 30%): Good result relevance
• Medium Click-through Rate (10-30%): Acceptable performance
• Low Click-through Rate (less than 10%): Poor result quality
• 0% Click-through Rate: No clicks - results not relevant
Conversion Rate
• Good CVR: Varies by industry (typically 2-10%)
• 0 CVR: No conversions recorded

Understanding the Data​

Search Volume Analysis​

Query Type
Characteristics
High-Volume Queries
• Most important for optimization
• Represent core user needs
• Impact largest number of users
Low-Volume Queries
• Long-tail searches
• Specific user needs
• May indicate niche opportunities

Click-Through Rate Patterns​

Click-through Rate Pattern
Indicators
High Click-through Rate Queries
• Well-matched results
• Clear user intent
• Good ranking algorithm
Zero Click-through Rate Queries
• Results not relevant
• Poor result positioning
• Need immediate attention
• May also appear in Searches without Results
Mixed Click-through Rate
• Some users find results useful
• Room for improvement
• Consider A/B testing

Conversion Rate Analysis​

Conversion Type
Indicators & Causes
Zero Conversions
• User didn't complete desired action
May indicate:
• Wrong products/content shown
• Pricing issues
• Checkout problems
• Informational searches (no purchase intent)
Positive Conversions
• Effective search-to-purchase flow
• Relevant results
• Good user experience

Working with Search Data​

Identifying Optimization Opportunities​

Step
Action
Details
Step 1
Sort by Searches
• Find high-volume queries
• Focus on queries with most impact
Step 2
Check Click-through Rate
• Low Click-through Rate + High Volume = Priority fix
• Improve result relevance
• Adjust ranking
Step 3
Review CVR
• High searches + Low CVR = Conversion issue
• Optimize landing pages
• Review pricing/offers

Using Filters​

Filter Type
Steps
Purpose
Filter by Source
1. Select analytics tag
2. See Overview for complete list
3. Apply filter to data
• Compare performance across sources
• Optimize each channel separately
• Identify best performing traffic sources
Compare Time Periods
1. Enable comparison mode
2. Select two date ranges
3. View side-by-side data
• Identify trends and changes
• Validate improvements
• Track performance over time

Search Query Optimization​

Query Issue
Optimization Steps
Expected Outcome
Low Click-through Rate Queries
1. Review actual results returned
2. Check if results match intent
3. Add synonyms or query rules
4. Improve ranking weights
5. Consider query suggestions
• Higher click-through rates
• Better result relevance
• Improved user satisfaction
• Increased engagement
Zero Conversion Queries
1. Verify products/content availability
2. Check result quality
3. Review landing page experience
4. Analyze pricing competitiveness
5. Consider merchandising rules
• Increased conversion rates
• Better business outcomes
• Enhanced user journey
• Higher revenue per search

Advanced Analysis​

Click Position Analysis​

Analysis Type
Available Metrics
Insights Gained
General Analysis
• Which results get clicked most
• Position of first click
• Scroll depth required
• Identify top-performing results
• Optimize result ranking
• Improve user experience
Modal View
(if available)
• Click on query row to open details
• View detailed metrics
• See click position heatmap
• Analyze popular results for query
• Deep dive into specific queries
• Visual representation of clicks
• Query-specific optimization
• Result performance patterns

Popular Filter Analytics​

Component
Features
Business Value
Filter Analytics Chart
• Bar graph showing filter usage
• Blue bars: Current period usage
• Green bars: Previous period (if comparing)
• Filter key breakdown (color, size, category)
• Visual trend identification
• Quick filter popularity assessment
• Period-over-period comparison
Filter Analytics Table
Columns:
• VALUE: Filter option selected
• USAGE COUNT: Times used
• UNIQUE SEARCHES: Distinct searches
• SUCCESS RATE: % leading to clicks/conversions
• AVG RESULTS: Average results returned
• Detailed filter performance data
• Conversion optimization insights
• Filter effectiveness measurement
Usage Examples
Color filter example:
• Blue: 3 uses, 100% success rate
• Grey: 3 uses, 100% success rate
• Pink: 2 uses, 100% success rate
• Understand filtering behavior
• Optimize filter options
• Add popular missing filters
Access Method
Click on any query row to view filter analytics for that specific search term
• Query-specific filter insights
• Targeted optimization opportunities
• Contextual filter performance

Notes​

Category
Details
Data Accuracy
• Real-time or near real-time updates
• Historical data available based on plan
• Export for deeper analysis
Click-through Rate Calculation
• Only counts searches where results were shown
• Does not include no-result searches
• May vary by result count
CVR Tracking
• Requires conversion tracking setup
• May not capture all conversion types
• Check tracking implementation
Query Normalization
• Similar queries may be grouped
• Case-insensitive
• Trimmed whitespace

Best Practices​

Daily Review​

Review Type
Actions
Purpose
Quick Check
• Sort by searches (descending)
• Review top 10 queries
• Check for any 0% Click-through Rate in top queries
• Identify immediate issues
• Monitor high-impact queries
• Quick health assessment
Red Flags
• High-volume query with 0% Click-through Rate
• Sudden drop in search volume
• New queries appearing frequently
• Urgent optimization needed
• Performance degradation alert
• User behavior changes

Weekly Analysis​

Analysis Type
Steps
Outcome
Deep Dive
1. Export top 50 queries
2. Categorize by intent (product, category, brand)
3. Calculate average Click-through Rate by category
4. Identify underperforming categories
5. Create optimization plan
• Comprehensive performance overview
• Strategic optimization roadmap
• Category-specific insights
Action Items
• Fix queries with search volume > 10 and Click-through Rate = 0%
• Optimize queries with Click-through Rate < 10%
• Enhance queries with conversions > 0 (maximize ROI)
• Immediate performance fixes
• Progressive improvements
• Revenue optimization

Monthly Strategy​

Strategy Component
Activities
Strategic Value
Trend Analysis
• Compare month-over-month
• Identify seasonal patterns
• Track impact of changes
• Measure improvement velocity
• Long-term pattern recognition
• Predictive insights
• ROI measurement
Optimization Priorities
1. Critical: High volume + Low CTR
2. High priority: Medium volume + Zero CTR
3. Medium priority: Low volume + Low CTR
4. Monitor: Improved queries for regression
• Resource allocation guidance
• Impact-based prioritization
• Continuous improvement cycle

Frequently Asked Questions​

Question
Answer
Action Required
Why are some queries showing 0% CTR?
Common reasons:
• Results not relevant to query
• Results poorly ranked (good items buried)
• No results returned (see Searches without Results)
• Query misspelled (add synonym)
• Technical issue with result display
Click query to see detailed analysis and review results
What's a good CTR for search queries?
Benchmarks:
• Product searches: 30-50% CTR
• Category searches: 20-40% CTR
• Brand searches: 40-60% CTR
• General terms: 15-30% CTR
Target depends on query type and industry
How do I improve CTR for specific queries?
Optimization steps:
1. Review results: Are correct items shown?
2. Check ranking: Are best items at top?
3. Add synonyms: Handle variations
4. Use rules: Boost/bury specific items
5. Improve attributes: Better searchable fields
Test changes using comparison mode
Why is my conversion rate 0 for all queries?
Possible causes:
• Conversion tracking not implemented
• Event not firing correctly
• Long conversion window (not captured yet)
• Product/service not suitable for immediate conversion
Verify conversion tracking setup in your integration
Can I see which results were clicked for each query?
Yes, if available in your plan:
1. Click on the query row
2. View detailed modal/page
3. See result click distribution
4. Analyze which items are most clicked
Use this to optimize result ranking
How do I export search data?
1. Apply desired filters (date, tags)
2. Click download icon (↓) in top right
3. Select format (usually CSV)
4. Open in Excel/Sheets for analysis
Export limits may depend on your plan
What's the difference between Searches and Searches Results?
Searches (current page):
• Query-level metrics
• Shows each search term
• Focus on query performance

Searches Results:
• Result-level metrics
• Shows which items were clicked
• Focus on individual products/content
Use both together for complete analysis
How often should I review search data?
Recommended:
• Daily: Top 10 queries, spot check CTR
• Weekly: Full analysis, prioritize fixes
• Monthly: Trend analysis, strategic planning
• After changes: Validate improvements using comparison mode
Follow recommended schedule for optimal results